One form of trading using technical analysis involves the use of triangle chart patterns. Triangle patterns come in three types: ascending, descending, and symmetrical. Most traders use these triangles as they are usually easy to spot on a chart, even among beginner traders.
In most cases, the patterns are used to identify areas where the price is likely to break out. They can also form when there is indecision among traders. This indecision occurs because the market is unsure of how a security will move up. Triangle patterns are also popular among traders because they are relatively easy to use. Moreover, you don’t always have to use the patterns alongside other technical indicators.
In this blog post, we are looking at the ascending triangle pattern, how to identify it on a chart, as well as what it tells us. Moreover, we will be sharing tips on how to trade and potentially make a profit when using the pattern.
In This Article
Ascending Triangle Trading Pattern: The Essential Guide
What Is An Ascending Triangle Pattern?

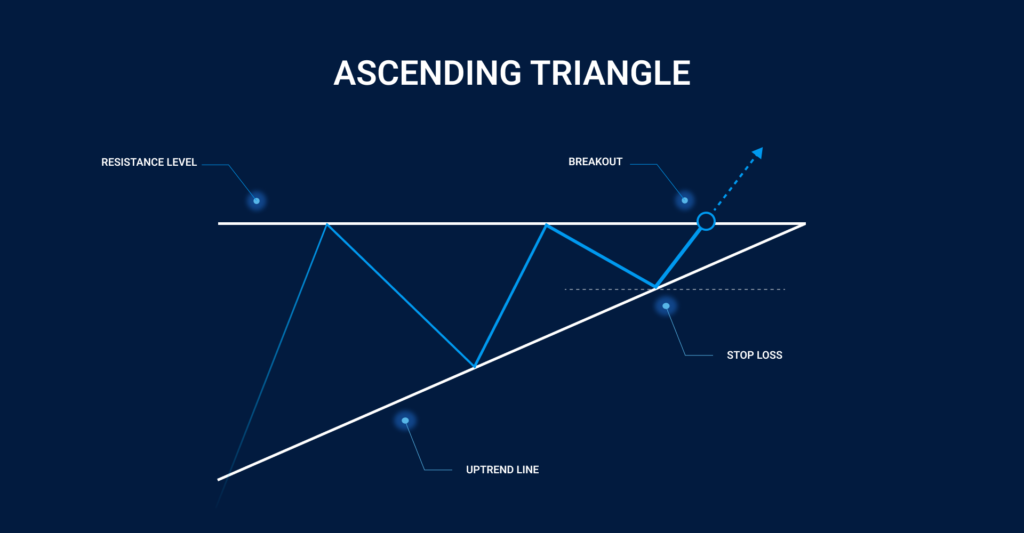
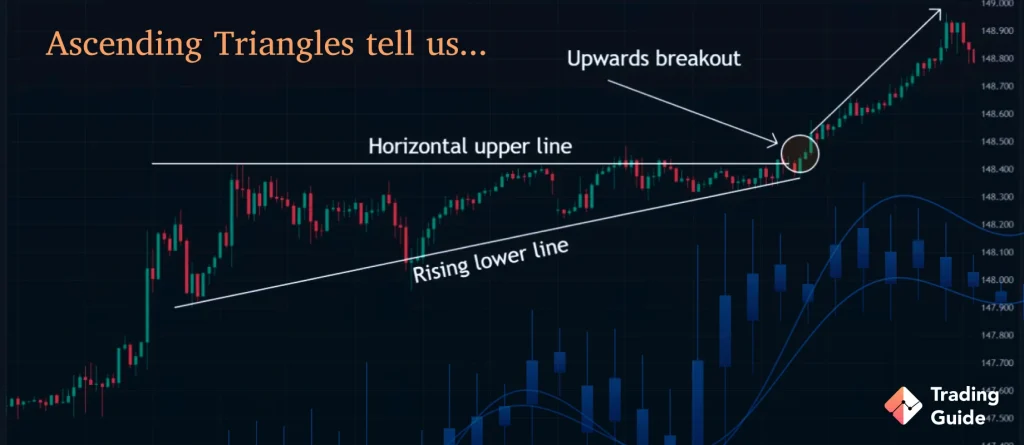
An ascending triangle is a bullish continuation pattern that forms during an uptrend and signals that the trend is likely to continue. Also known as the bullish triangle pattern, the ascending pattern appears frequently on price charts and is one of the most commonly used charting patterns. The pattern happens when a stock or other traded security is moving higher but then encounters resistance.
It is drawn by joining lower points and the point where it encounters resistance. Ascending triangles are characterised by a flat upper trendline that is used as a rising lows trendline and resistance level. This pattern is the opposite version of the descending triangle and is often used to identify price consolidation during an uptrend and to enter a long position when the price breaks above the upper resistance horizontal line.
Identifying an Ascending Triangle Pattern
The following is a simple breakdown of the most important action points you should keep in mind when identifying the ascending triangle pattern:
- There must be an established trend in the price to continue.
- The lower trend line should be a rising trend line.
- The upper trend line has to be horizontal.
- The trend lines must be touched at least two times. The more times the trend line is touched, the stronger it gets and so will the pattern be considered more reliable.
What Causes Ascending Triangles Patterns to Form?
Institutional investors and hedge funds may hold large amounts of shares in a company. Once the stock price goes up, these investors might decide to close their positions to seek better opportunities elsewhere.
Let’s assume they sell the shares, but only down to a certain price like £30. Since there are so many shares being sold on the market, the price of that stock cannot go above £30 because it will force the institutional investors and hedge funds to sell as soon as it does.
Once word gets out that large investors are dumping the stock, other sellers get into the game and push the price down even further. When all the sellers walk away, then the buyers jump in, thinking the stock is undervalued at this low price and begin to push it up, even higher than it was before. This leads to the formation of an ascending triangle pattern on the price chart.
What Do Ascending Triangles Tell Us?
As we’ve mentioned above, ascending triangles often appear when a stock has big sellers at a certain level. These triangles tell us that some traders are trying to pull the price down. These could either be short-sellers or profit-takers.
Other traders and investors may be interested in purchasing the stock. When the share price hits resistance again and fails to drop further, the higher lows are in and that is where a trendline can be drawn. At this point, an ascending triangle can be seen forming.
The pattern becomes clearly visible when it bounces between the resistance and trendline. Then more buyers jump into the action. If you are a short seller, you will need to cover your position and become a buyer yourself. Other short sellers can be forced to cover as the stock price breaks out into a short squeeze.
How to Trade the Ascending Triangle Pattern

Ascending triangle patterns provide the best entry point and clear stop-loss levels and profit targets. Here is a simple guide for trading stocks using ascending triangle patterns:
- Wait for the stock to break the flat resistance level: When trading ascending triangle patterns, you need to wait for the stock to move above the flat resistance line before you can place a trade. If you buy shares earlier you may get a better price, but you will also be exposing yourself to additional risk. Try to be patient and set an alert in your trading software if you would like.
- Keep an eye on volume: High volume in a stock indicates that a large number of traders are interested in the stock. Above-average volume is not needed for an ascending triangle pattern breakout, but it may raise the chances of a bigger move.
- Look for confirmation: The flat line resistance level should become a support level if an ascending triangle breakout is legit. If the price begins to pull back after the breakout, you need to look for the previous resistance level to use as support. You can use this to confirm the legitimacy of the breakout. This can also allow you to take a position if you missed the initial move.
- Have an exit strategy: As a trader, you should always have an exit strategy for both winning and losing trades. If the price pulls back and falls below the support level, you may consider closing your position since you are not sure if the breakout is genuine. You should also have a plan for when to take profit if the price is going in your favour.
Trading ascending triangle patterns is not really hard if you are familiar with how it works and have one of the best UK trading platforms. However, like all chart patterns, ascending triangles are not always reliable. Therefore, always try to be careful when using them to make trades. One of the main problems you are likely to face when you rely on them, or any type of chart pattern, is false breakouts.
A false breakout happens when the price moves outside the triangle, indicating a breakout before changing its course. The major drawback of this situation is the losses you are likely to experience.
However, it is important to keep in mind that not all breakouts will be false. Indeed, false breakouts can sometimes help you execute trades based on anticipation. For example, if you are not actively in a trade but you see that a stock has made a false breakout opposite to what you anticipated, you could consider jumping into the trade.
Ascending Triangle Pattern – Pros and Cons
- Ascending triangles patterns are very easy to spot on a chart
- It is one of the most accurate and reliable continuation patterns to use in technical analysis
- The patterns have clear entry points, stop-loss levels, and profit targets
- They frequently appear in all markets and tradable securities including stocks, forex, cryptocurrencies, etc
- Does not clearly define where to place a stop loss
- There is a possibility of false breakouts
Ascending Triangle Vs. Descending Triangle
Descending triangle patterns are the complete opposite of ascending triangle patterns. Ascending triangle patterns reveal bull market trends, where stock prices are going up, and the lows are higher. On the other hand, a descending triangle pattern forms on a bearish or downtrend chart.
The pattern is drawn in a similar method as an ascending triangle pattern.Its slope is drawn from the lower highs while the lower flat line is drawn by joining the lows for the stock. The lower highs indicate bears are in control, but the support line at the bottom does not allow the price to drop further. Trading volume also plays a crucial role in this pattern and the days are the same as the ascending triangle.
FAQs
Ascending triangles are most reliable when found during an up trend. When trading this pattern, always ensure to confirm that trend and volume are in your favour and be cautious of false breakouts.
Triangle patterns come in three types: ascending triangle, descending triangle, and symmetrical triangle.
The ascending triangle is a bullish continuation pattern. It appears during an uptrend and suggests that the trend is likely to continue.
The descending triangle is a bearish continuation chart pattern. It appears during a downtrend and indicates the continuation of the downtrend.
The symmetrical triangle pattern represents price consolidation and signals the continuation of the previous trend. It forms when the price of a security is making lower highs and higher lows.
Yes. Although ascending triangles are bullish, sometimes, a breakout of the ascending trendline can produce a bearish signal. If it occurs within a downtrend it can be said to be a bearish continuation pattern.
The ascending triangle is the most bullish triangle, as it usually forms during a bull trend and indicates increased buying pressure. If a bullish breakout occurs at the end of an ascending triangle this confirms the pattern.
Conclusion
Trading ascending triangle patterns is an invaluable skill that can help any trader significantly boost their trading accuracy. It is also essential to learn the other types of triangle patterns that exist in order to take advantage of more trading opportunities in the market.
By studying the ascending triangle pattern, you have acquired an important tool that you can use in your trading journey. Practice now and then to successfully identify the pattern on charts and test them in a demo account before trading with real money.


