Ask any investor why they love stocks or funds that track major stock indices, and they will likely tell you how great it feels to receive regular dividends or how the stock market is the key to building long-term wealth.
Stocks serve as a cornerstone for many portfolios due to their growth potential. The stock market has a long track record of providing higher returns compared to cash alternatives or bonds.
That being said, investing in stocks also has some risks. In investing, risks and returns are highly correlated. Therefore, equities with higher potential returns have a higher level of risk. Moreover, the value of the stocks you own will fluctuate from time to time, and you can lose all your money.
Despite these risks, investing in the stock market is still one of the most effective ways to put your money to work and potentially grow wealth through the returns you get.
Historically, the annual average stock market return has been approximately 10%, before inflation. This figure is based on the performance of the S&P 500 Index since its inception in 1957.
But what does the average return of the stock market mean for you? And is it something you can count on? In this blog post, we’ll look at the average stock market return in the last 10 years, how it compares to inflation and what you can do to maximise your returns.
Average Return Definition And Calculation

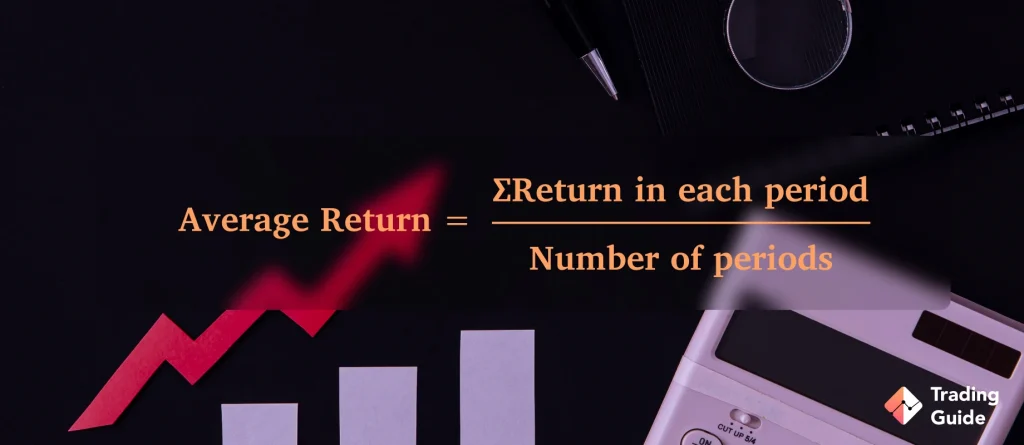
As you dip your toes into stock investing, the average return is a term you are likely to hear over and over again. This is the simple mathematical average of a series of returns recorded over some time. It is calculated the same way a simple average is calculated. To arrive at the average, the series of returns is added together and the single sum is then divided by the number of returns in the series.
Average Return= Sum of Returns divided by the Number of Returns
For example, let’s say an investment posts the following annual returns over ten years: 11%, 9%, 12%, 26%, 17%, 6%, 10%, 7%, 15%, and 13%. The ten annual returns are summed up and then divided by 10 to get the average return for the market over these five years. We end up with an average annual stock market return of 12.6%.
What is the Average Stock Market Return?

The average return of the stock market refers to what the market has returned historically over a particular period. As we previously mentioned, the annual average return of the S&P 500 has been about 10% since it was introduced in 1957. This average doesn’t consider inflation. When adjusted for inflation, the average historical stock market return has been about 7% a year.
However, the average fluctuates widely from year to year. In fact, it is highly unlikely that any one year will post an average market return. Some years record bigger returns than the average, while others go into the red.
For instance, the S&P 500 declined more than 4% in 2018. But during the following year, the index delivered a whopping 31.5%. In 2021 and 2022, the index returned 18.4% and 28.7%, respectively. However, when many years of returns are put together, these peaks and troughs begin to even out.
Why The S&P 500 Is Widely Used To Measure Returns

Investors and analysts commonly use the S&P 500 Index as a benchmark to measure the overall stock market performance. The S&P 500, short for Standard & Poor’s 500, is a stock index comprised of the 500 largest companies in the United States.
It is one of the most widely watched stock market indices as most of the stocks it contains are owned by individual investors. The index includes shares of 400 industrial companies, 40 public utilities, 40 financial institutions, and 20 transportation companies.
While there are thousands more stocks traded on American stock exchanges, the index makes up roughly 80% of the entire stock market value on its own, thus making it a valuable benchmark against which portfolio performance is evaluated.
However, it is important to understand that average stock market returns can also be based on other major indices such as the Dow Jones Industrial Average (DJIA) or the FTSE 100 Index. Keep in mind that the average index fund return varies depending on the securities it tracks. In addition to individual stocks, investors can also trade indices such as the S&P 500 to participate in the broader market movements.
Average Return Of S&P 500 In The Last 10 Years
As of the end of November 2022, the historical average annual return of the S&P 500 is 11.88% over the last 10 years. This average assumes that investors have reinvested their dividends. When taking inflation into account, the S&P 500’s 10-year average return (including dividends) is 9.18%.
Average Return Vs. Inflation

One of the main reasons you could see a smaller or bigger return than the average during any given year is inflation. Generally, inflation brings down stock prices as consumer spending tends to drop. As a result, investors opt for value stocks instead. Although some stocks are regarded as “inflation-resistant”, periods of high inflation tend to hurt returns.
Of course, investors know that there is a certain level of inflation every year, and they usually adjust their expected returns against the expected inflation. For example, suppose they expect a return of roughly a 5% average return on stocks a year after inflation, and inflation is 2% a year. In that case, they will expect a return of about 7% a year when inflation is taken into account.
However, if inflation unexpectedly jumps from 2% to, say, 3% very quickly, history suggests the stock market will respond negatively and investors will now demand a higher return to compensate for the now-higher risk. Instead of a 7% return, investors may demand an 8% return.
Market Returns During Recessions

The stock market usually tops out before the start of downturns and bottoms out before their conclusion. In nearly every case, the S&P 500 bottoms out approximately four months before the conclusion of a recession. Typically, the index hits a high seven months before the start of a recession.
During the last downturn from February 2020 to April 2020, which was triggered by the Covid-19 pandemic, the S&P 500 finished the year over 16% higher. During the global financial crisis of 2008 (a more prolonged recession), the stock market plunged nearly 40% that year before rallying 23% in 2009.
Setting Realistic Return Expectations

Research suggests that many investors anticipate an average return on investments far higher than can be expected. While we all want to get as much as possible out of the investments we make in the stock market, it is important to set realistic expectations. Miscalculating your projected returns could put you in a financially vulnerable position.
The returns you receive from your stock investments will depend on numerous factors; from the amount of risk you are willing to accept to economic aspects beyond your control. As a result, it is something that you should carefully consider when building up your investment portfolio.
Set realistic return expectations that align with the current market environment, and more importantly, your objectives and goals. While a good stock market return is the long-term average of 10%, a realistic return is usually between 4% to 6% per year.
However, there is no one-size-fits-all approach to investing. Your return and portfolio should reflect your unique long-term objectives and financial situation. Keep in mind that the most important number should be the year-to-year and not the day-to-day.
Essential Tips To Maximise Your Returns

One of the best things you can do to earn returns that are close to the stock market average return is to seek professional help and hire a financial advisor. An advisor can guide and steer you from making emotional decisions that could mess up your portfolio.
But if you are going to manage your portfolio, you will have to be disciplined and keep your emotions out of the buy/sell process. Here are a few tips that you can consider to make smarter decisions.
- Do nothing. A thoughtful and conscious decision to do nothing is still a form of action. If your long-term financial goals have not changed and you built your portfolio around them (as it should be), short-term market fluctuations should not worry you.
- Your money is like a bar of soap. To quote renowned economist Eugene Fama, “Your money is like a bar of soap. The more you handle it, the less you’ll have.” While actively managing your portfolio can be beneficial, making frequent or large changes can be disastrous, especially if they are motivated by emotion.
- Never sell stocks in a market downturn. If you have a balanced stock portfolio, you should never rush to sell some stocks when the market is taking a beating. Just as you would not rush to put a “for sale” sign on your home when the housing market is shaky, don’t rush to get rid of the stocks you own when the market falls into bear territory.
- Trust science. It has been academically proven that investors who take a disciplined investing approach have increased chances of earning higher market returns. If you are not disciplined, you probably shouldn’t be managing your portfolio.
FAQs
Yes. According to many financial analysts, an annual return of 7% is a good return for an investment in stocks. This is slightly lower than the average annual return of the S&P 500.
The S&P 500 average annual return is approximately 10%, without inflation. However, that does not mean that investors who decide to put money in this market index will always realise a 10% return on their investment.
While this 10% average return has held remarkably steady for many years, there are no guarantees in the market. Because of volatility, returns can be much lower or much higher than 10% in a given year.
No. An annual return of 10% is good but not realistic. Anyone who could consistently generate a return of 10% for 30 consecutive years would be one of the greatest investors of all time. That being said, a realistic long-term annual return should be between 4% to 6%.
Yes. It is possible to live off returns. However, it depends on the kind of returns you are receiving from your investments and the amount of money you plan to spend per year. Also, remember that no investment guarantees return, and the more risk you take to achieve higher returns, the higher the probability of losing some of your investment.
Stocks that pay high dividends tend to be found in the utilities, consumer staples, and telecommunications sectors. Companies in these sectors tend to generate stable and predictable cash flows, thus allowing them to pay high dividends.
Some examples of companies that have historically paid high dividends include Procter & Gamble, AT&T, Exxon Mobil, Johnson & Johnson, and Verizon Communications.
Conclusion
The stock market has historically created an enormous amount of wealth, with overall gains outweighing the losses. This is why investing in stocks is part of a long-term strategy for most investors. By buying and holding your stock investments for the long term, you have a better chance of hitting the S&P 500’s historical average return of 10%.
With thoughtful investment, you can make good returns and achieve your financial goals and dreams. Keep in mind that there is no guarantee that your investments will meet expectations even when they are carefully calculated. Most importantly, never invest in stocks with money that you cannot afford to lose.


