


Day trading is one of the most popular trading styles in the UK and globally, along with position trading and swing trading. If you are new to the investing world and don’t know what day trading is all about, don’t worry. In this blog post, you will learn the basics of this trading style and gain valuable insights into some of the most commonly used day trading patterns.
In This Article
What
What is Day Trading?
Day trading is a trading method used by traders who aim to profit from small price fluctuations by opening and closing positions within the same day. In day trading, the goal is to make a small profit on each trade and add to those earnings over time. Profits or losses depend on fluctuations in the price of stocks or other tradable financial instruments.
By and large, day trades are executed online with the help of online brokers. For the most part, day traders open and close out positions for a profit or a hedged loss at the end of each day and begin afresh the next.
For example, if you are trading stocks listed on the London Stock Exchange (LSE), the market usually opens at 8:00 a.m. and closes at 4:30 p.m. Therefore, if you buy shares in the morning, let’s say around 10:00 a.m., you have to sell them before the closing bell at 4:30 p.m., say around 3:00 p.m.
However, some traders may be tempted to hold their positions overnight, particularly when things go wrong during the day. Holding day trades overnight is considered a very risky activity. The reason for this is there are bad news events that can happen overnight and have a devastating impact on the share price.
Why Day Traders Use Chart Patterns
Day traders utilise a wide array of tools to improve their performance. Chart patterns are perhaps the most essential tool they rely on to interpret price action and make informed decisions on trades.
For day traders to genuinely know when they will be able to book profits and when they should cut their losses, they have to rely on Japanese candlesticks and other types of stock charts that tell them about market sentiments, trends, and momentum. Patterns are an essential part of day trading. They produce periodic and recurrent signals that help traders filter out market noise and make informed trading decisions.
Candlesticks are the most popular types of chart patterns day traders rely on to make trades. These charts were invented in the 18th century by a Japanese rice trader Munehisa Homma. Known as the “god of the markets” in his day, Homma realised price action reflects market psychology. He used to draw price patterns on his rice parchment paper, and kept a record of the open, high, low and close of each day.
Today, there are numerous candlestick patterns that you can use to trade stocks, forex, commodities, cryptocurrencies, and more. They convey useful information like the bullishness/bearishness, volume, and trend at a simple glance.
Candlestick charts consist of red and green candles. The period that each candle covers depends on the time frame selected by the trader. For example, in a 15-minute candlestick chart, each candlestick represents a 15-minute period. In a 30-minute candlestick chart, each candlestick represents a 30-minute period and so on.
In general, candlestick patterns are categorised into three broad categories:
- Bullish reversal patterns
- Bearish reversal patterns
- Continuation patterns
That being said, here is a list of five types of candlestick chart patterns that frequently appear on charts when day trading. These patterns are the most common and recognisable chart patterns to keep an eye on when using technical analysis to day trade stocks, commodities, forex, and more.
1. Bull Flag Pattern
One of the most popular patterns that some of the best day traders in the world have in their arsenal is the bull flag. This is a bullish chart pattern that forms when a stock is in a strong uptrend. It is called a flag pattern because it resembles a flag on a pole.
For a pattern to be considered a bull flag, it must be preceded by a sharp rally in the price of an asset and then followed by a series of parallel resistance and support levels within the consolidation phase.
Bull flag patterns make it easier for day traders to spot continuations in price and capture huge price fluctuations with ease. You can leverage the information provided by this day trading pattern to determine good entry points where risk is low compared to the possible reward.
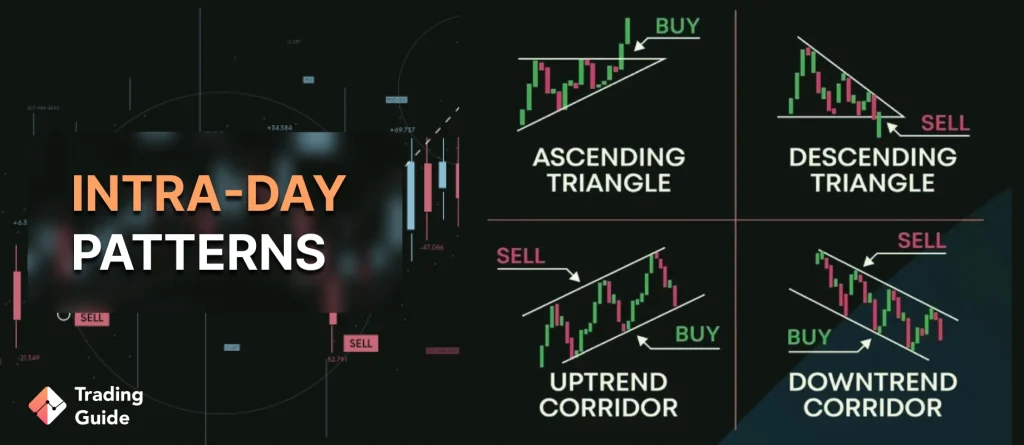
2. Ascending Triangle Pattern
The ascending triangle chart pattern is another bullish continuation pattern that day traders like to trade off when it forms. This pattern appears during a bull trend and suggests that the trend is likely to continue. Traders like the ascending triangle chart pattern because it provides clear trading signals, including low-risk entry points.
Ascending triangles are characterised by a flat upper trendline used as a rising lows trendline and resistance level. When the pattern appears on a chart, it signals a bullish breakout above the resistance area. The breakout typically happens around the time when the ascending line of the triangle joins the horizontal resistance line. It is also worth noting that the strongest breakouts are accompanied by high volume.
When trading ascending triangle patterns, consider placing a stop loss slightly under the horizontal resistance line because a breakout may fail even if it is accompanied by high volume.
3. Rising Wedge Pattern
Many day traders are also familiar with the rising wedge pattern as it can be incredibly reliable and has the potential to provide significant returns if traded correctly. Rising wedges are usually a bearish indicator because they are immediately followed by a downtrend.
The pattern appears on a chart when the price of an asset fluctuates between two upward-sloping and converging trend lines. The pattern is quite common in the stock market and can be useful at any time.
For this formation to appear on a chart, the price of an asset has to be in a strong downward trend. As the price falls, it encounters some resistance as bears start to take profits. Consequently, the price forms a pattern that looks like an ascending triangle. A genuine rising wedge ought to have a good oscillation between the two trend lines. To confirm this pattern, each of the lines should have touched at least twice.
While rising wedges are an excellent tool for day trading, they also have some downsides. For instance, they can take several hours to form on a chart. Moreover, beginner day traders can easily confuse them with other candlestick patterns like flags and pennants.
4. Cup And Handle Pattern
The cup and handle chart pattern has been used for decades and is one of the many that day traders look out for because it has an excellent risk/reward ratio and is easy to recognise with its U shape. It is a bullish continuation pattern that was popularised by famous stock trader William J O’Neil in his book “How to Make Money in Stocks.”
The pattern resembles a cup with a handle. When forming on a chart, the cup pattern appears first, and then the handle pattern follows. A cup and handle pattern tells you that a bullish trend is likely to continue after a consolidation phase.
If you are using this pattern to trade, you need to remain bullish as the price will likely maintain the upward trend after breaking past the resistance level. You can also wait for the security to retest the now-support level and make a bullish trade.
Alternatively, you can use a buy-stop trade to profit from a bullish trend. In this case, you can place a buy-stop order above the handle’s resistance line. Your order will only execute after the price rises above the resistance level.
5. Head and Shoulders Pattern
The head and shoulders pattern is probably one of the best ways for day traders to identify a trend reversal in charts. The pattern comprises three peaks: left shoulder, head and right shoulder. Its middle peak is usually the highest and signifies the head, with the other peaks symbolising both the right and left shoulders.
H&S is a bearish indicator because it usually sends a signal that a bullish trend will soon turn bearish. When the pattern forms after a bearish move, it signals that sellers are losing momentum, thus leading to a new bullish trend. Volume is usually an essential thing when trading the head and shoulders pattern. Changes in volume can help you to know whether the pattern is forming or not.
H&S is easy to spot on a chart, and is known to occur in all time frames. If you are using it to make day trades, it is essential to wait until it completes. Additionally, it would be a great idea to set up an entry, stop and profit target.
To start trading you need a trading platform. Discover the best trading apps in the UK with our other article.
FAQs
Determining the best day trading approach typically requires several hours of daily research. So, if you want to become a full-time day trader, you must be prepared to spend a minimum of 40 hours a week researching and executing trades.
The answer to this depends on the securities that you are day trading. Typically, the best time to day trade stocks is immediately after the stock market opens and shortly before it closes. These periods are the most appropriate for day trading because they provide much liquidity (high volume) and significant market moves.
The same is true when you are day trading other securities such as commodities and forex. These securities usually record a lot of volume at the intersection of the European and American sessions and the intersection of the Asian and European sessions.
The best pattern for day trading will depend on your research and other market factors. With that being said, some of the most popular patterns among experienced day traders include the ascending triangle pattern, cup and handle, head and shoulders, bull flag, and the rising wedge pattern.
Yes. Using a 15-minute chart is good for day trading because the aim is to open and close positions many times per hour/day. You can use the 60-minute chart to establish the primary market trend. From there, you can use 15-minute charts to establish short-term trends.
Yes. Day trading is a particularly common trading style for beginners. Although this trading style is risky, beginners can take some time to learn its ins and outs before trading with real money. If you are trying your hand at day trading for the first time, you need to practise various day trading strategies to gain more confidence and succeed.
Yes. While the vast majority of day traders end up losing money, it is a highly profitable trading method for some. Many financial advisors and professional money managers argue that the rewards of day trading don’t justify the risks. However, it is still possible to make good profits from day trading if you have a good strategy and know how to properly manage risk.
Conclusion
Day trading is a perfect investing method for traders who don’t have the time to sit on the trading screen throughout a day’s trading session. You can combine day trading with their 9-5 job or any other business so that you can generate a separate source of consistent cash flow for yourself. With proper risk management and using chart patterns to recognise market turning points, it is possible to make good profits from day trading.

I've been day trading for a while now and honestly these patterns like bull flags and cup-and-handle setups have saved me so many times - they really do help cut through all the market noise when you're trying to make quick decisions. The tricky part is that sometimes what looks like a perfect ascending triangle ends up being a fake breakout, so I've learned to always wait for volume confirmation and never risk more than I can afford to lose on a single pattern.